Analytics Tracking for Form Data Insights
Collecting orders, registrations, and other information is the primary purpose of forms and surveys. In addition to the answers collected, broader data is available like demographics, popularity, etc. This is where the analytics tools are helpful in quickly displaying that data in a visual and useful way.
 Tables, charts, and graphs are used to show the data as groups of answers so that you can quickly see how each group compares with the others, which assists form owners in improving their forms, optimizing conversions, and targeting the right visitors.
Formsite’s results analytics tools include:
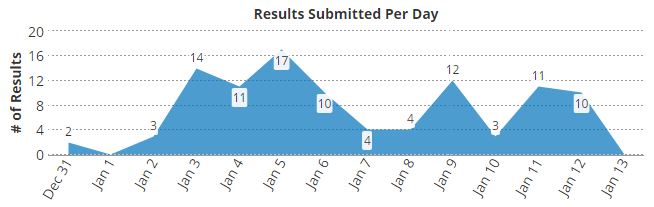
- Number of results per day
- Technical statistics
- Duration & Fall-off statistics
- Individual Item Summary
- Inventory & Scoring analysis
- Cross-tabulation
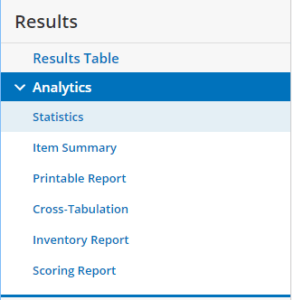
Statistics
The statistical information shows some of the popular basic analytics for your form. This information, like number of results per day, is shown on the Results -> Analytics main page in a line graph, and the period shown can be set to show 1 week to 3 months.
The technical statistics are used to show what browser and operating system the form visitors use when completing the form and can help to expose more information about the form visitors.
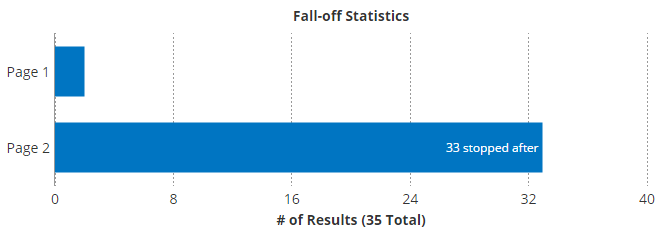
A newly-added statistic is the Fall-off, which shows for multi-page forms where visitors who don’t complete the form stop filling it out. Being able to see where incomplete visitors stop their progress is a great tool for optimizing forms for maximum conversions.
Item Summary
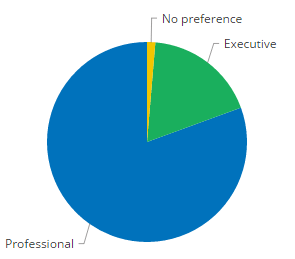 The Item Summary is typically the most useful tool in that it allows form owners to view the answers for each item as a graph to quickly see which is the most popular choice. The summary tool allows instant switching between a pie chart, bar graph, and text for maximum legibility and usefulness.
Customizing Analytics
The Item Summary and Scoring Report can all be customized using the Results Views, Results Filters, and Results Labels tools. Using custom views, filters, and labels allow for viewing the data in virtually any combination to expose useful insights.
Notes & Tips
A common question is how to export the charts and graphs for use with Word or another document publishing program. The best way to capture the information is by taking a screen shot of the chart and saving as an image, which can then be placed in the document.
- Windows users can find the Snipping Tool included with Windows 10
- Mac users can use the key combination Shift-Command-4 to show the crosshairs, then select the area to capture