Charts and Graphs Updates for Formsite Reports and Analytics
Formsite’s automated charts and graphs give form owners instant real-time views of form results. The built-in Results Reports and Analytics features use charts and graphs to display results in a visual format. In many situations, charts make seeing relative differences between result answers much easier.
We’ve made updates to the technical provider for the charts and graphs to give form owners a better result. The new solution benefits form owners with responsive and attractive charts backed by Google.
Changes to Charts and Graphs
Currently the Results -> Analytics -> Statistics page shows the new Google Charts. The rest of the Analytics pages and Results Reports roll out soon. With the goal of making the transition invisible, implementation needs no changes by account owners.
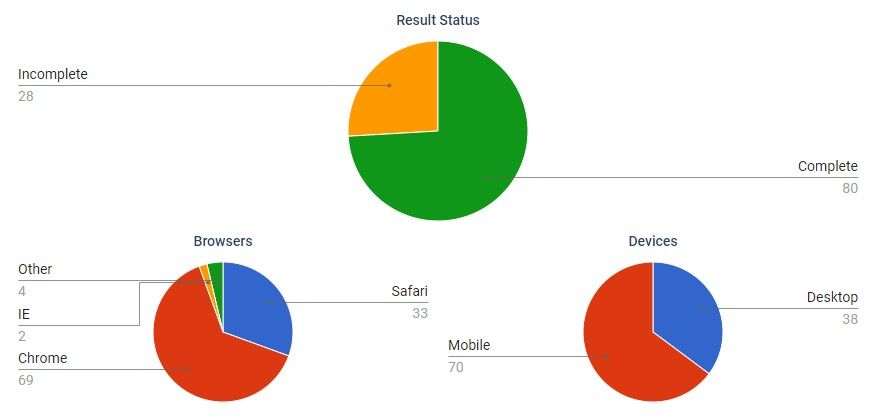
The most noticeable change is the appearance and layout of the charts and labels. The new charts have more readable labels and values than before, with easier to see leader lines. The segments in pie charts contain a single pixel space for easier differentiation. The colors come from Google and provide a high-contrast variety for easy reading, too.
About Formsite Analytics and Results Reports
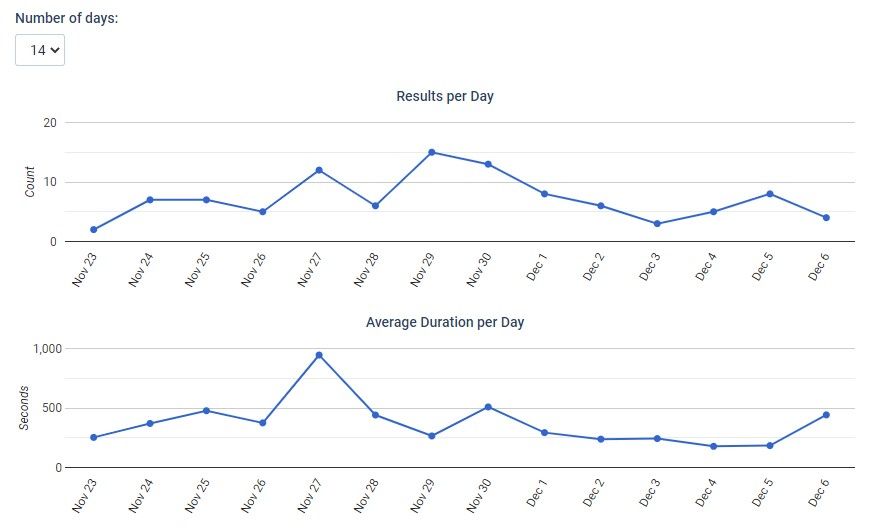
For form owners new to the Analytics and Results Reports, these areas allow for results data as graphics in real time. The Analytics -> Statistics page shows line graphs with Results per Day and Average Duration per Day. The statistics also include charts showing the percentage of complete results, browsers, and mobile use.
The other pages in the Analytics area include:
- Item Summary: Displays the results by each item as either text or chart (depending on the item type)
- Cross-Tabulation: Ways to create custom comparisons between two multiple-choice items
- Inventory Report: A matrix showing each item’s Inventory setting and number taken
- Scoring Report: Displays the distribution of scores across all results
Results Reports provide form owners with a shared version of the form’s Results Table. Results Filters and Results Views display results and items that meet specific conditions. See the support documentation page for how to set up Results Reports.
Creating a Results Report assigns unique URLs for the report’s Table and Charts versions, allowing form owners to share or embed the report. Sharing the report’s link via email is the most common method. Embedding the report uses an iframe tag with either the Table or Chart URL as the src, for example:
<iframe src="https://..." title="Results chart" style="width:80%;min-width:800px;min-height:800px;border:none;"></iframe>