Show Real-time Charts with Results Reports
Surveys and quizzes can sometimes benefit from showing the form visitor how others answered. For example, consider a survey or voting form with a few options. The survey owner may want to display each option’s status after each result as a pie chart or bar graph. Formsite’s Results Reports let form owners show charts in real-time.
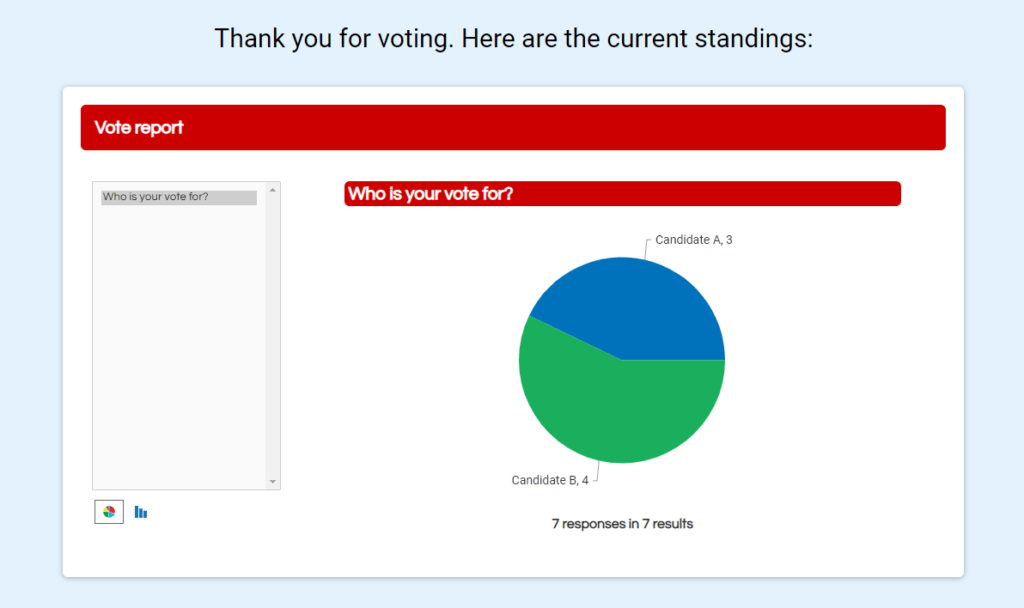
Quiz results can also display immediately to show how the quiz-taker performed. For instance, the Results Reports can show each question as a chart showing the results for each answer. Another option uses Scoring to calculate the overall score and a percentage to assign a grade.
Real-time Charts
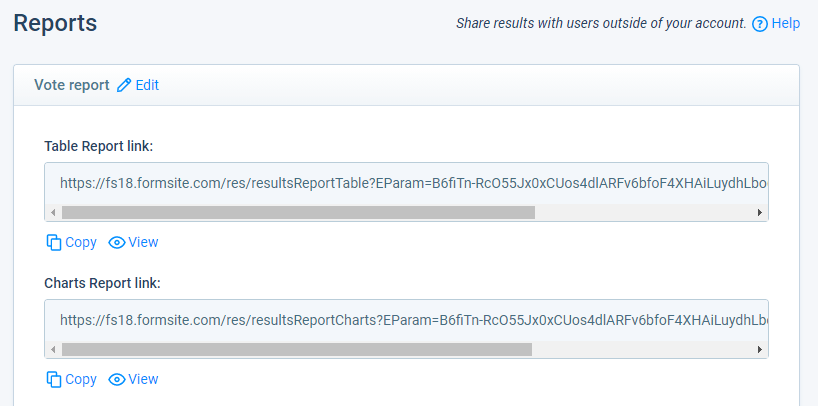
Results Reports allow form owners to create publicly available results for forms and surveys. Accessed at Results -> Results Reports, this page displays the results without allowing access to the form or Formsite account.
Reports can display either the raw data in a table format, or as a chart or graph. Also, both options (table and charts) allow for filtering the data to show only what’s needed.
For example, reports can show specific groups of questions or answers using Results Filters and Results Views. The built-in Results Views contain an ‘All items’ view and an ‘All items plus Statistics’ view. The ‘Statistics’ include the date, user information, status, etc., which do not show on reports using just the ‘All items’ view.
Creating Reports
Form owners create reports on the Results -> Results Reports page. The Results Filters page allows for only showing results that meet the criteria, such as those containing a specific answer.
The system generates a unique link for the table version and the chart version for all reports. That link is for the specific Results Report and will always show the most up-to-date results in real time.
Accessing Reports
As a link: Send the Results Report link in an email or post on a page to allow visitors to access the report. Encourage bookmarking or saving as a shortcut for fast access at any time.
Embedded on a page: Use an iframe HTML tag to display the report embedded on the page. The iframe source address is the Results Report link and the style can set the size and position as needed.
<iframe src="https://..." title="Results chart" style="width:80%;min-width:800px;min-height:800px;border:none;"></iframe>
On a Success Page: Show the chart on the form or survey’s Success Page for instant feedback. Use the same iframe method with the Custom Success Page format to always show after every successful result.